

OpenTME provides pre-computed spatial readouts for thousands of TCGA whole-slide images, generated with Atlas H&E-TME— capturing cell classes, tissue types, and neighborhood features, paired with TCGA's genomic, transcriptomic, and clinical data. But rich data is only useful if you can explore it easily.
That's what TME Studio is for. It's our companion suite of notebooks for turning OpenTME's readouts into analyses — no need to build everything from scratch. In this post, we take you on a tour of TME Studio, using the TCGA bladder cancer cohort to walk through the kinds of analyses it makes possible: verifying slides, exploring cohort composition, examining spatial organization, and running survival analysis.
TME Studio: Your launchpad into OpenTME
TME Studio is a companion suite of Marimo notebooks designed to help you get started with OpenTME. It is organized into three categories:
- Tutorials: Step-by-step notebooks to help users get started, covering foundational tasks such as loading and exploring the dataset and its metadata.
- Examples: Concise notebooks demonstrating specific analysis types, such as tumor immune phenotyping (inflamed / desert / excluded classification), Kaplan–Meier survival plots, feature outlier detection, and clustering.
- Demo: A showcase notebook featuring a selection of plots and analyses that together give a quick sense of the range of what OpenTME supports.
The notebooks can be run directly in your browser using molab. For further customization of the notebooks, they can be forked and edited in molab or used locally, via the tme-studio GitHub repository.
Example Analysis: TCGA-BLCA Bladder Cancer Cohort
To showcase how researchers can use OpenTME and TME Studio to start answering their research questions, we explored a bladder cancer cohort of 385 patients, following the layout of the Demo notebook. It illustrates just a handful of the analyses possible with OpenTME. Since every step comes straight from the notebook, you can open it and reproduce the whole analysis as you read.
Verifying slides before analysis
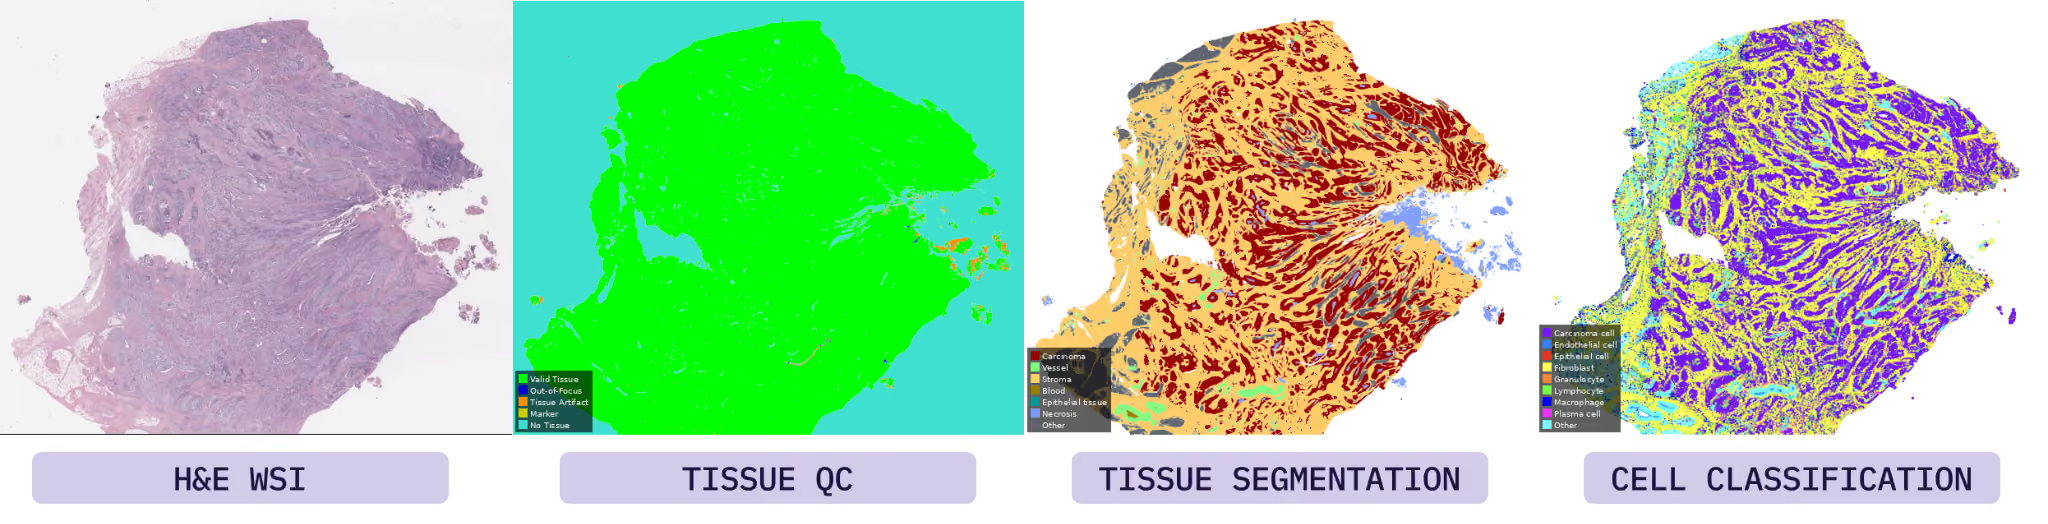
TME Studio starts where any analysis should — with the slides themselves. For each slide, it provides a preview thumbnail of the original H&E whole-slide image (WSI) alongside thumbnails of the tissue quality control (QC), tissue segmentation, and cell classification overlays generated by Atlas H&E-TME. This lets you verify slide identity and processing quality before proceeding, while giving a high-level overview of the tumor and its environment.
Exploring cohort-level composition
A natural starting point is grouping slides by clinical variables such as survival status, tumor stage, or the molecular subtype of interest, then examining how tissue and cell composition varies across groups. In TME Studio, users select the cell metric and tissue type of interest, and the plots update accordingly.
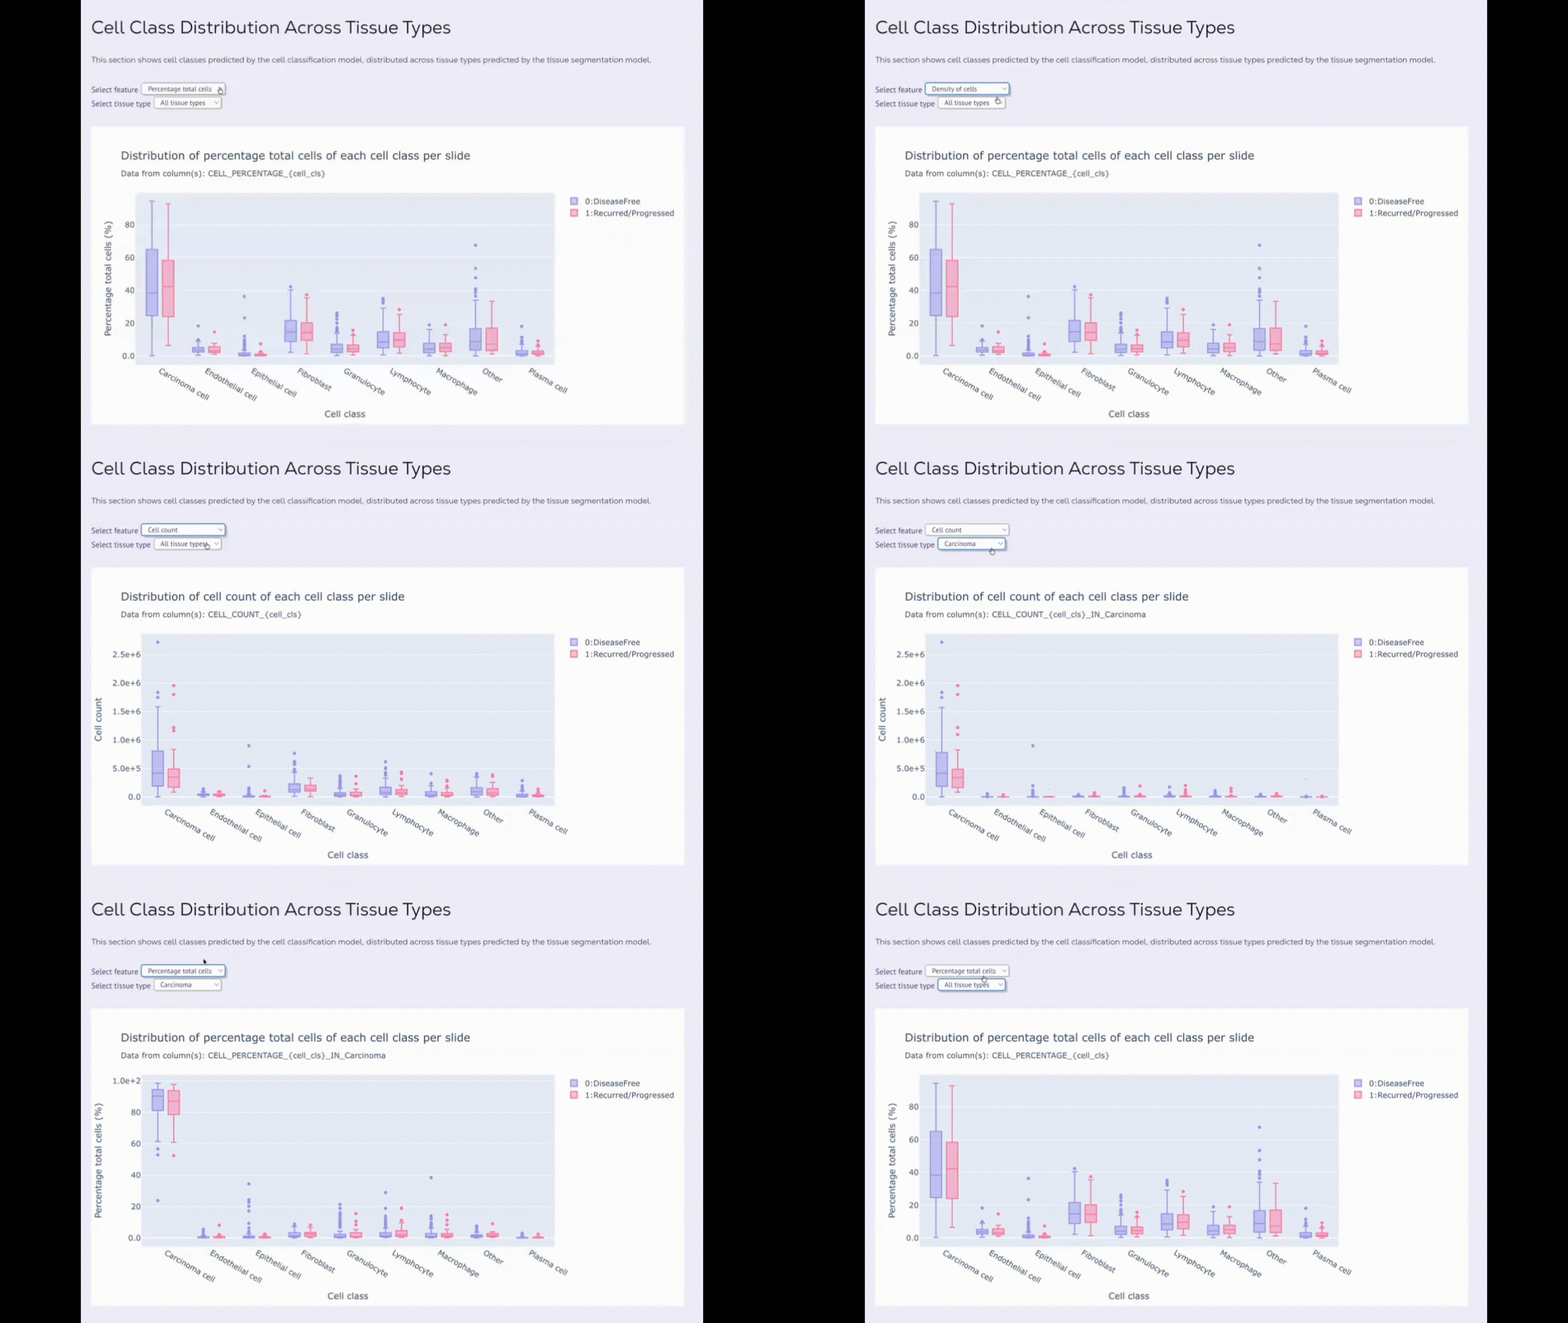
This supports a range of initial questions such as: How does immune cell density in carcinoma differ across tumor stages? Does endothelial cell density — a proxy for tumor vasculature — track with subtype? Researchers can move from raw data to a publication-style plot in a few steps.
Examining spatial organization: Neighborhood analysis
Composition tells you what cells are present; neighborhood features tell you how they are arranged. For each cell type, OpenTME provides counts of the cells of each class within a defined radius, so researchers can quantify not just which cells are present, but also the cellular neighborhood surrounding them. In TME Studio, users can select a reference cell type, a tissue type, and a radius, and the plot will show the distribution of neighboring cell classes around that reference cell within the chosen compartment.
Beyond viewing this distribution for a single group, users can group these features by variables of interest. The example below compares the 40 µm neighborhoods of carcinoma cells across molecular subtypes of bladder cancer.
%20(1).gif)
Building a targeted analysis: Immune phenotyping
TME Studio also lets you combine multiple OpenTME features into a single derived readout. Using lymphocyte density in carcinoma and stroma with interactive thresholds, the immune phenotype of the tumor can be classified as inflamed, desert, or excluded (IDE) — a classification that is an important contributor to immunotherapy response and a common axis for patient stratification (left).
From there, the IDE classification can be carried into a Kaplan–Meier survival curve to assess its association with patient outcomes (right), producing a meaningful analysis built on combining OpenTME features with TCGA survival metadata. Within TME Studio, this analysis can be performed for any feature of interest.
.gif)
Get Started
The analyses in this tour represent just a fraction of what TME Studio and OpenTME make possible — the combination of rich spatial features and TCGA's molecular depth opens the door to a wide range of multimodal research questions. OpenTME currently includes 8 indications: bladder, breast, lung, colorectal, liver, pancreas, prostate, and stomach. Additional indications and new spatial features are added on a rolling basis.
OpenTME is available through two paths:
For academic researchers: Request free access on Hugging Face using your academic email address, and open up TME Studio to explore the analyses for yourself.
For life sciences teams: OpenTME is also available to biopharma as a gold-standard external cohort for generating and validating hypotheses at scale. Get in touch to learn more.
TME Studio makes OpenTME easy to explore today. Looking ahead, we're building an even more powerful way to explore OpenTME: an agentic tool that lets you ask research questions in natural language and have the analysis run for you, end to end, no code required. More on that in the coming months.